EDA or exploratory data analysis as the name suggests is used to explore a dataset. To better understand the data, descriptive statistics as well as visualisation plots are used. EDA can allow you to make preliminary conclusions about your data such as certain patterns that are detected or correlations between variables.
In this article, I will use data from the London data store to explore crime data in boroughs across London. You may choose to use data from other resources such as Kaggle however the underlying methods used to explore the data remain the same.
My goal in using the London boroughs crime data is to answer 2 questions:
1) Which borough has the largest number of reported crime in 2019?
2) How did the crime rate in london vary over the recorded months?
Let's start by reading in the data.
## import some Python modules for handling data and plotting
import pandas as pd
import matplotlib.pyplot as plt

## read in the data file
df = pd.read_csv('MPS Borough Level Crime (most recent 24 months).csv')

## explore the dimensions and columns of the dataset
df.shape
#(1575, 27)

df.columns

#Index(['MajorText', 'MinorText', 'LookUp_BoroughName', '201712', '201801',
#       '201802', '201803', '201804', '201805', '201806', '201807', '201808',
#       '201809', '201810', '201811', '201812', '201901', '201902', '201903',
#       '201904', '201905', '201906', '201907', '201908', '201909', '201910',
#       '201911'],
#      dtype='object')


## rename my columns
df = df.rename(columns={'MajorText': 'crime_group', 'MinorText': 'crime', 'LookUp_BoroughName': 'boroughs'})

df.head()

#                 crime_group  ... 201911
#0  Arson and Criminal Damage  ...      8
#1  Arson and Criminal Damage  ...     92
#2                   Burglary  ...     30
#3                   Burglary  ...    113
#4              Drug Offences  ...     10
#
#[5 rows x 27 columns]
Now for the first task:
1) Which borough has the largest number of reported crime in 2019?
As you can see from the data columns, we have crime data reported between January to Novermber 2019.
First we will sum up all the crime counts for every borough over the months of 2019 then plot a histogram to view the results.
## look at the boroughs we have:
boroughs = df.boroughs.unique()
boroughs

#array(['Barking and Dagenham', 'Barnet', 'Bexley', 'Brent', 'Bromley',
#       'Camden', 'Croydon', 'Ealing', 'Enfield', 'Greenwich', 'Hackney',
#       'Hammersmith and Fulham', 'Haringey', 'Harrow', 'Havering',
#       'Hillingdon', 'Hounslow', 'Islington', 'Kensington and Chelsea',
#       'Kingston upon Thames', 'Lambeth', 'Lewisham', 'Merton', 'Newham',
#       'Redbridge', 'Richmond upon Thames', 'Southwark', 'Sutton',
#       'Tower Hamlets', 'Waltham Forest', 'Wandsworth', 'Westminster'],
#      dtype=object)
In the code below we are going to create a subset by borough name and then use iloc to extract just 10 rows of this subset.
## look at 1 borough subset
df[df.boroughs == 'Westminster'].iloc[:10,]

#                               crime_group  ... 201911
#1525             Arson and Criminal Damage  ...      8
#1526             Arson and Criminal Damage  ...    147
#1527                              Burglary  ...    247
#1528                              Burglary  ...    196
#1529                         Drug Offences  ...      9
#1530                         Drug Offences  ...    306
#1531  Miscellaneous Crimes Against Society  ...      0
#1532  Miscellaneous Crimes Against Society  ...      0
#1533  Miscellaneous Crimes Against Society  ...      0
#1534  Miscellaneous Crimes Against Society  ...      0
Now that you have a better idea of what is found in our dataset, we will write some code to sum up all the crime counts for every borough between the months of January and Novermber 2019.
## create a minimised dataset with only the columns we need
temp_df = df.drop(['crime_group', 'crime', '201712', '201801', '201802', '201803', '201804', '201805', '201806', '201807', '201808', '201809', '201810', '201812'], axis=1)

## create a function that woud give us a single sum for a borough
def add_borough_matrix(input_df):
    col_indx = input_df.shape[1]
    b_sum = 0
    for i in range(1, col_indx):
        b_sum += sum(input_df.iloc[:,i])
    return b_sum

boroughs_crime_count = []
for borough in boroughs:
    b_df = temp_df[temp_df.boroughs == borough]
    b_count = add_borough_matrix(b_df)
    boroughs_crime_count.append(b_count)

df_result = pd.DataFrame({'borough': boroughs, 'crime count': boroughs_crime_count})

## save the result into a CSV file
df.to_csv('borough_crime_count.csv', index=False, header=True)

## view the first 10 rows we got
df_result.iloc[:10,]

#                borough  crime count
#0  Barking and Dagenham        20042
#1                Barnet        31313
#2                Bexley        17954
#3                 Brent        30481
#4               Bromley        24912
#5                Camden        39394
#6               Croydon        33430
#7                Ealing        31582
#8               Enfield        30219
#9             Greenwich        28705
This is the total count of crimes per borough reported between January 2019 and November 2019. Now let's see what the result looks like:
## plot a histogram
sorted_result = df_result.sort_values(by=['crime count'])
plt.bar(sorted_result.borough, sorted_result['crime count'])
plt.xlabel('Borough')
plt.ylabel('Crime Count')
plt.title('Crime count per borough - 2019')
plt.xticks(rotation=90)
plt.show()
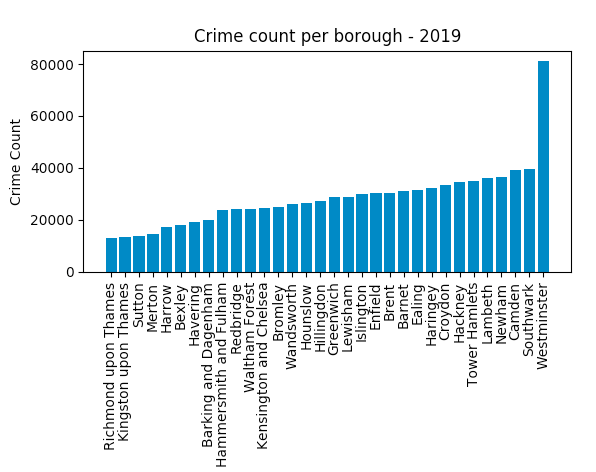
Westminster appears to have the highest number of reported crime. It might not be the safest place to move to after all!
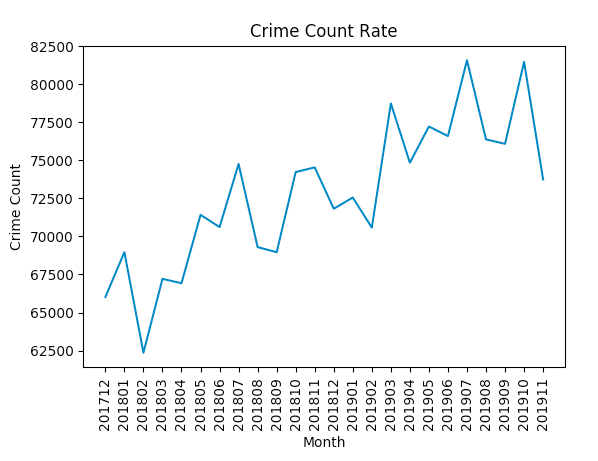
2) How did the crime rate in london vary over the recorded months?
Now for our final task, we will drop some columns from our original dataset, sum up the crime counts per month and then plot the result. From the graph, we can see that crime seems to have gone up.
df = df.drop(['crime_group', 'crime', 'boroughs'], axis=1)
df.columns

#Index(['201712', '201801', '201802', '201803', '201804', '201805', '201806', '201807', '201808', '201809', '201810', '201811', '201812', '201901', '201902', '201903', '201904', '201905', '201906', '201907', '201908', '201909', '201910', '201911'], dtype='object')


crime_per_month = []
for month in df.columns:
    crime_per_month.append(sum(df[month]))

## plt the result
plt.plot(df.columns, crime_per_month)
plt.xlabel('Month')
plt.ylabel('Crime Count')
plt.title('Crime Count Rate')
plt.xticks(rotation=90)
plt.show()